Over the past year, ESG, impact, and DEI efforts have faced shifting political priorities, economic pressures, and growing scrutiny. These shifts have put sustainability commitments to the test and reinforced the importance of focusing on what’s truly material.
At Northzone, that focus has always been our backbone. We approach sustainability and impact not because it’s required, but because we believe it’s the best long-term strategy for building meaningful value, resilient (and engaged) teams, and enduring companies.
We’ve been publishing our Responsible Scaling Survey (along with our Sustainability Notion Page) for three years now, as we aim to provide a transparent, evolving view of how we – and our portfolio companies – approach responsible growth, as well as understanding the impact of our actions and products.
There’s no one-size-fits-all approach. We’re moving beyond static formats to build a customized, filterable dashboard that presents portfolio data across different stages, commitments, and years. Our hope is that this format makes learnings from the data more actionable, transparent, and genuinely useful to both our portfolio and the broader ecosystem.
You can explore the full dashboard here.
A Growing, Evolving Portfolio
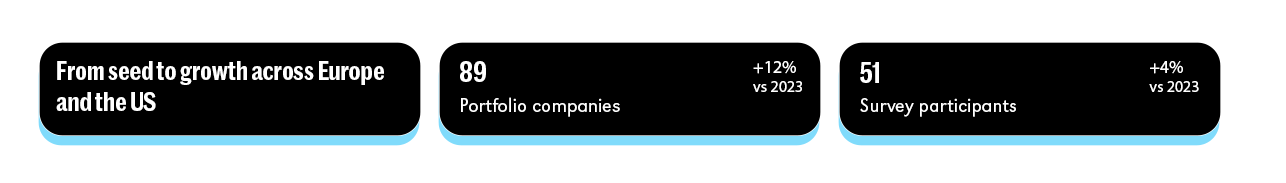
We invited 89 active portfolio companies to participate in this year’s Responsible Scaling Survey and received responses from 57% – a slight drop from last year. This reflects broader market conditions, but also natural shifts in our portfolio: we’ve added more early-stage companies and phased out several later-stage ones following exits.
This evolution impacts everything from total headcount to participation rates, and – as is often the case – affects metrics like carbon accounting, policy adoption, and diverse representation. Early-stage companies often operate with leaner teams, less formal structures, and more limited internal capacity, making it harder to prioritize and report on these practices early on.
Embedding Sustainability in How We Work
Over the past 12 months, we’ve focused on data quality over quantity, and on rooting sustainability principles more deeply into how we work as a firm. We’ve found that these principles stick best when integrated into existing workflows: through our investment process, people practices, and platform support.
STRENGTHENING OUR FOUNDATIONS
- We’ve adopted the Invest Europe ESG reporting framework to streamline data collection and make benchmarking across our portfolio more consistent and useful
- We’ve continued close collaboration with our ESG data partner, Apiday, to improve data coverage, automate survey workflows, and ensure alignment with evolving standards
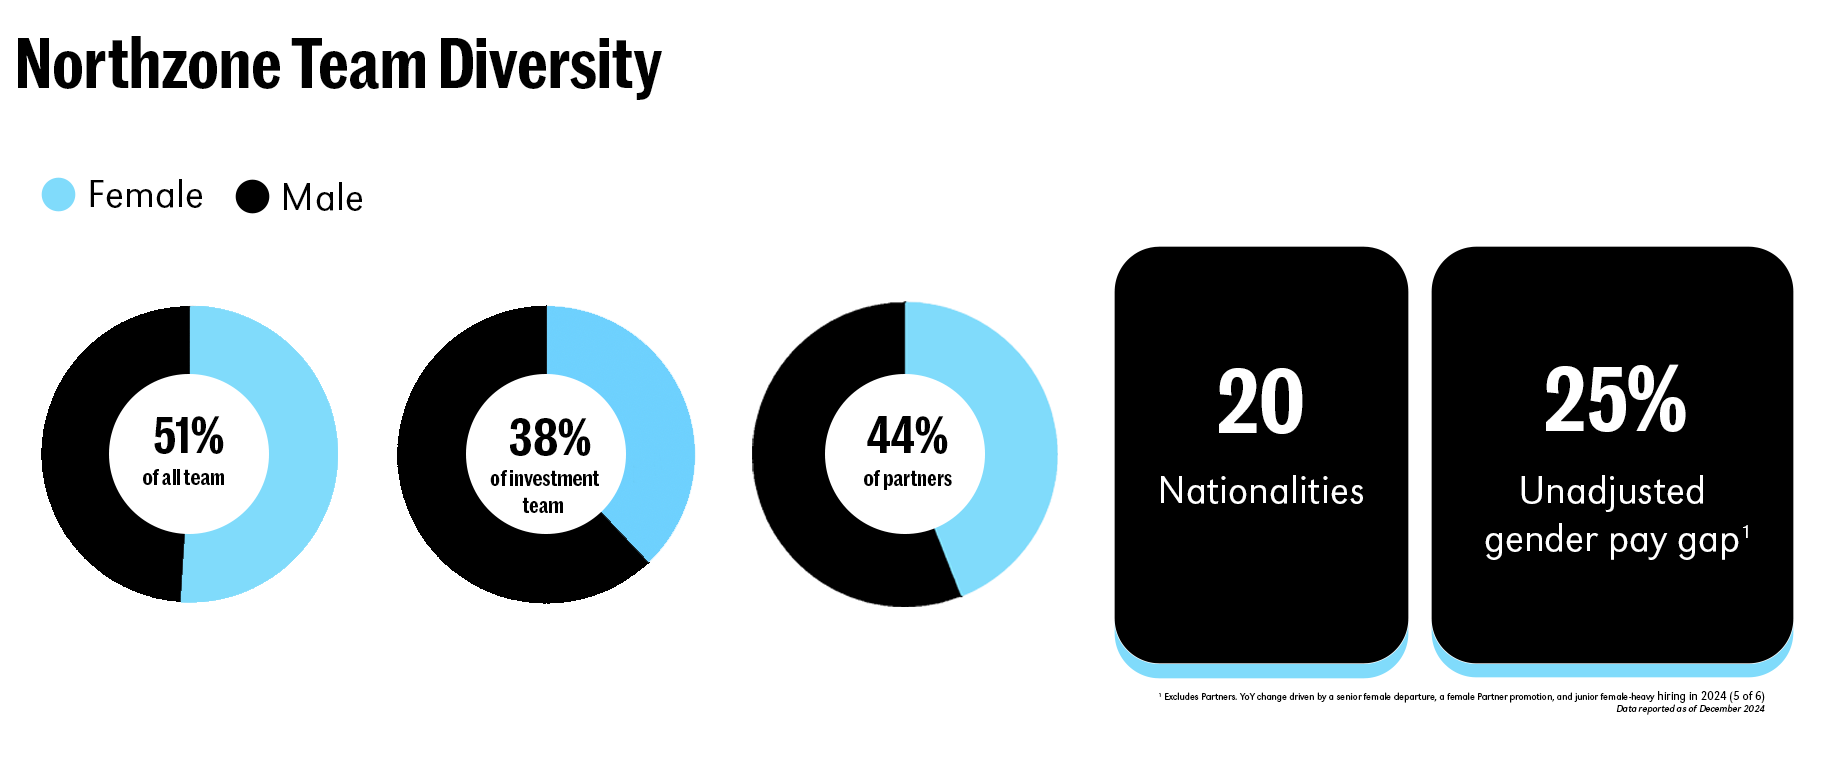
- We’ve maintained a strong focus on DEI within our own team – continuing to build an inclusive culture and proudly upholding our diversity metrics, now based on self-reported data
- We have continued building internal policies and infrastructure that reflect the same standards we encourage in our companies.
- Further evolved our responsible investment approach, ensuring that both our policy and our day-to-day work reflect our values and long-term commitments. A short version of our Responsible Investment Policy is available on our website, with a more detailed version shared directly with relevant stakeholders.
SUPPORTING WHAT OUR FOUNDERS VALUE MOST
When working with our portfolio companies, we often start with the “S” in ESG. That’s because human capital is where founders are already focused, and where we can add immediate value. Social topics like leadership, team structure, culture, and wellbeing are often the most tangible entry points – and create trust and traction early on.
Instead of creating standalone tracks, we focus on embedding these across our platform support:
- Talent & People support across recruiting, DEI, compensation, culture, and team design
- Founder coaching and peer-based Coaching Circles
- Our Operator Network of experienced advisors and subject-matter experts, supporting our companies from single conversations to regular engagements
- Peer Matchmaking connecting operational leaders across the portfolio for mutual support, shared learning and a sense of community
- Themed sessions and seminars on topics like pricing, GTM, technology risk, and scaling orgs
- Annual portfolio feedback loops to refine our platform support based on founder needs – including a dedicated section on sustainability in our annual survey
MATERIALITY, MOMENTUM, AND WHAT WE’RE STILL MISSING
Not every ESG topic is equally material at every stage – and this year, we’ve leaned more deeply into that insight.
Our dashboard introduces a stage-based view, allowing users to filter (a selected set of) metrics by funding stage. Even at a glance, it’s clear that adoption of practices like carbon accounting, tracking employee wellbeing, or diverse board representation tends to increase around Series B and beyond.
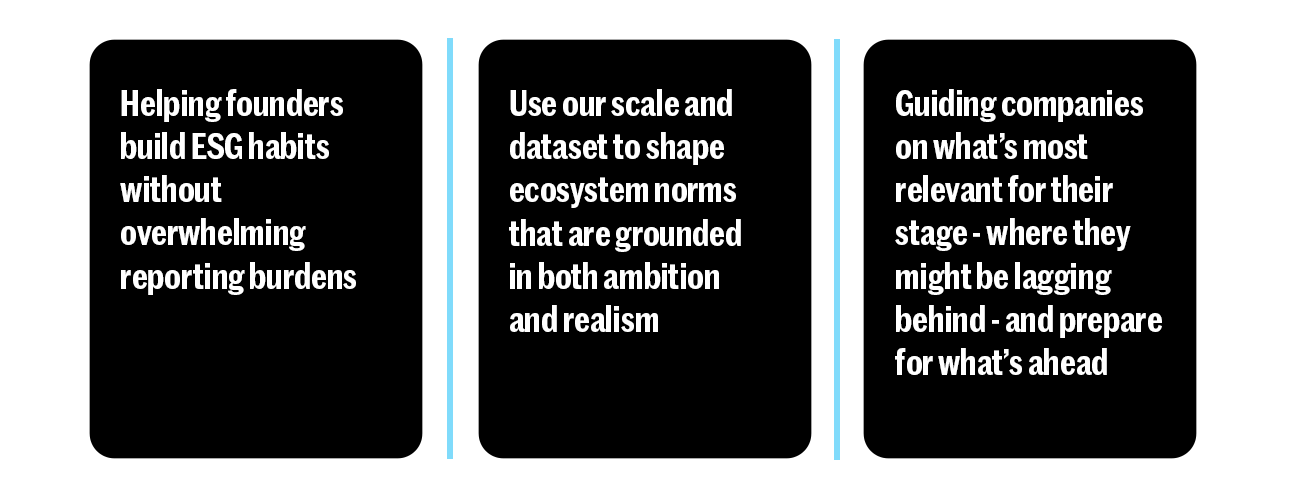
To reflect that nuance, we also adopted the Invest Europe framework and adjusted our survey expectations by maturity. The goal was to make ESG engagement more accessible for early-stage teams. But the reality was mixed. Participation dropped among smaller and younger companies, underscoring a continued challenge: how do we engage teams earlier, without adding reporting burdens too soon?
We believe more timely, founder-friendly touchpoints – combined with a more stable market – can help close this gap and build strong practices from the start.
What we are working toward:
Insights from the Data
Our dashboard is designed to do what traditional impact reports often don’t: let the data speak for itself.
The main change is building our own dashboard (on top of the foundation we’ve previously used, provided by Apiday) has given us more ownership over the structure and more flexibility in what we track, offering a better way to reflect the evolution of our portfolio year over year.
It’s filterable, stage-aware, and continuously updated. Rather than walking through every number here, we’re spotlighting a few emerging patterns – and inviting you to explore the full view.
https://northzone.databutton.app/measuring-what-matters
CLIMATE SIGNALS
In 2024, our operational emissions increased, driven primarily by more comprehensive reporting and our Berlin office expansion. While this growth reflects greater accuracy, it also underscores how business decisions shape emissions baselines.
Meanwhile, financed emissions (Scope 1 & 2 from portfolio companies, adjusted for our ownership) declined – largely due to a combination of lower reported emissions, reduced average FTEs, and the exit or write-off of several higher-emitting companies. Altogether, these shifts contributed to a ~13% net reduction in our total footprint year-over-year.
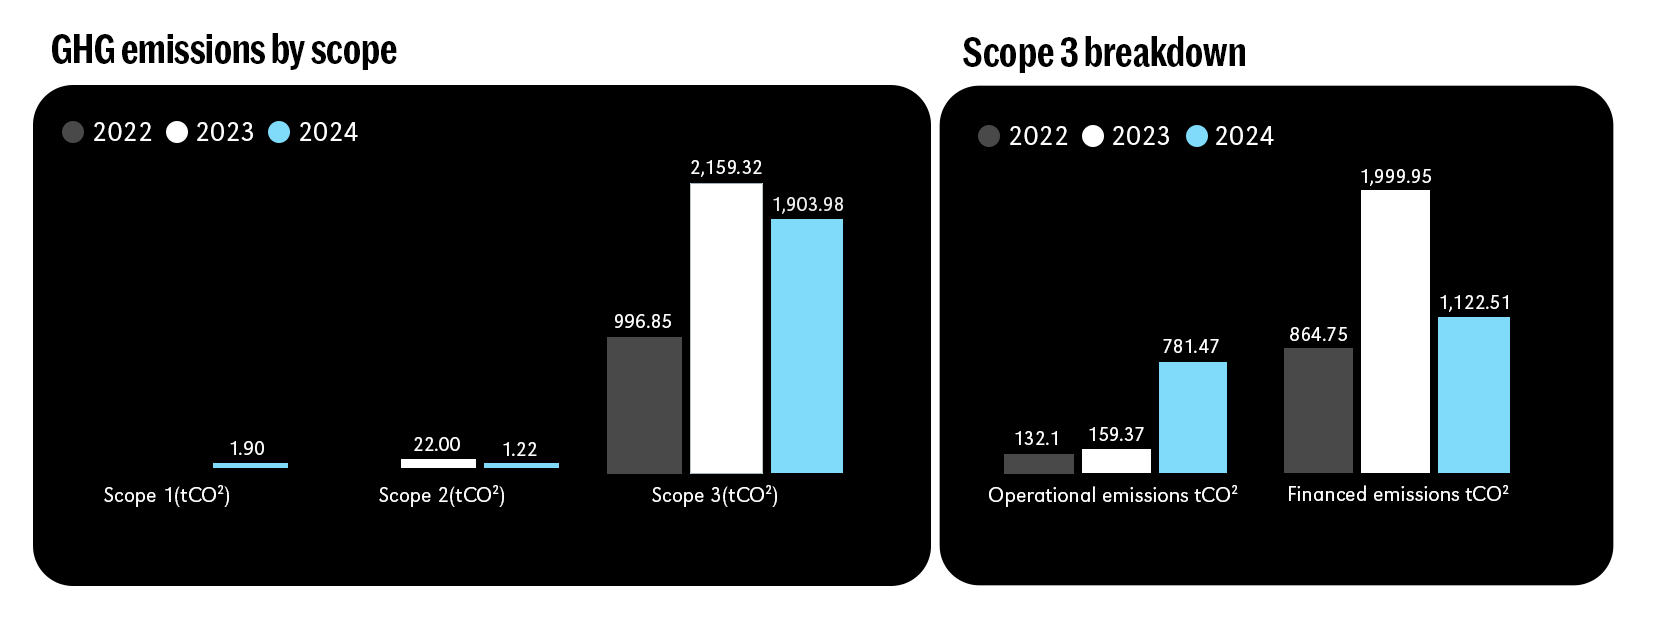
Since 2022, we have applied an internal carbon fee, with proceeds donated to the Milkywire Climate Transformation Fund, aiming to drive carbon reduction beyond our direct footprint.
On the portfolio side:
- Carbon measurement is on the rise, especially as more companies reach Series A or B and begin formalizing their ESG practices
- Fewer companies reported active reduction initiatives compared to last year, highlighting a gap between knowing your footprint and acting on it
- We continue to offer practical support – from emissions estimation tools to peer learning – to help companies turn carbon tracking into action
IMPACT IDENTITY VS. PRACTICE
We continue to back companies that embed positive impact into their business models – regardless of sector or label. Each year, we assess the portfolio’s alignment to the Sustainable Development Goals (SDGs) to better understand our collective contribution.
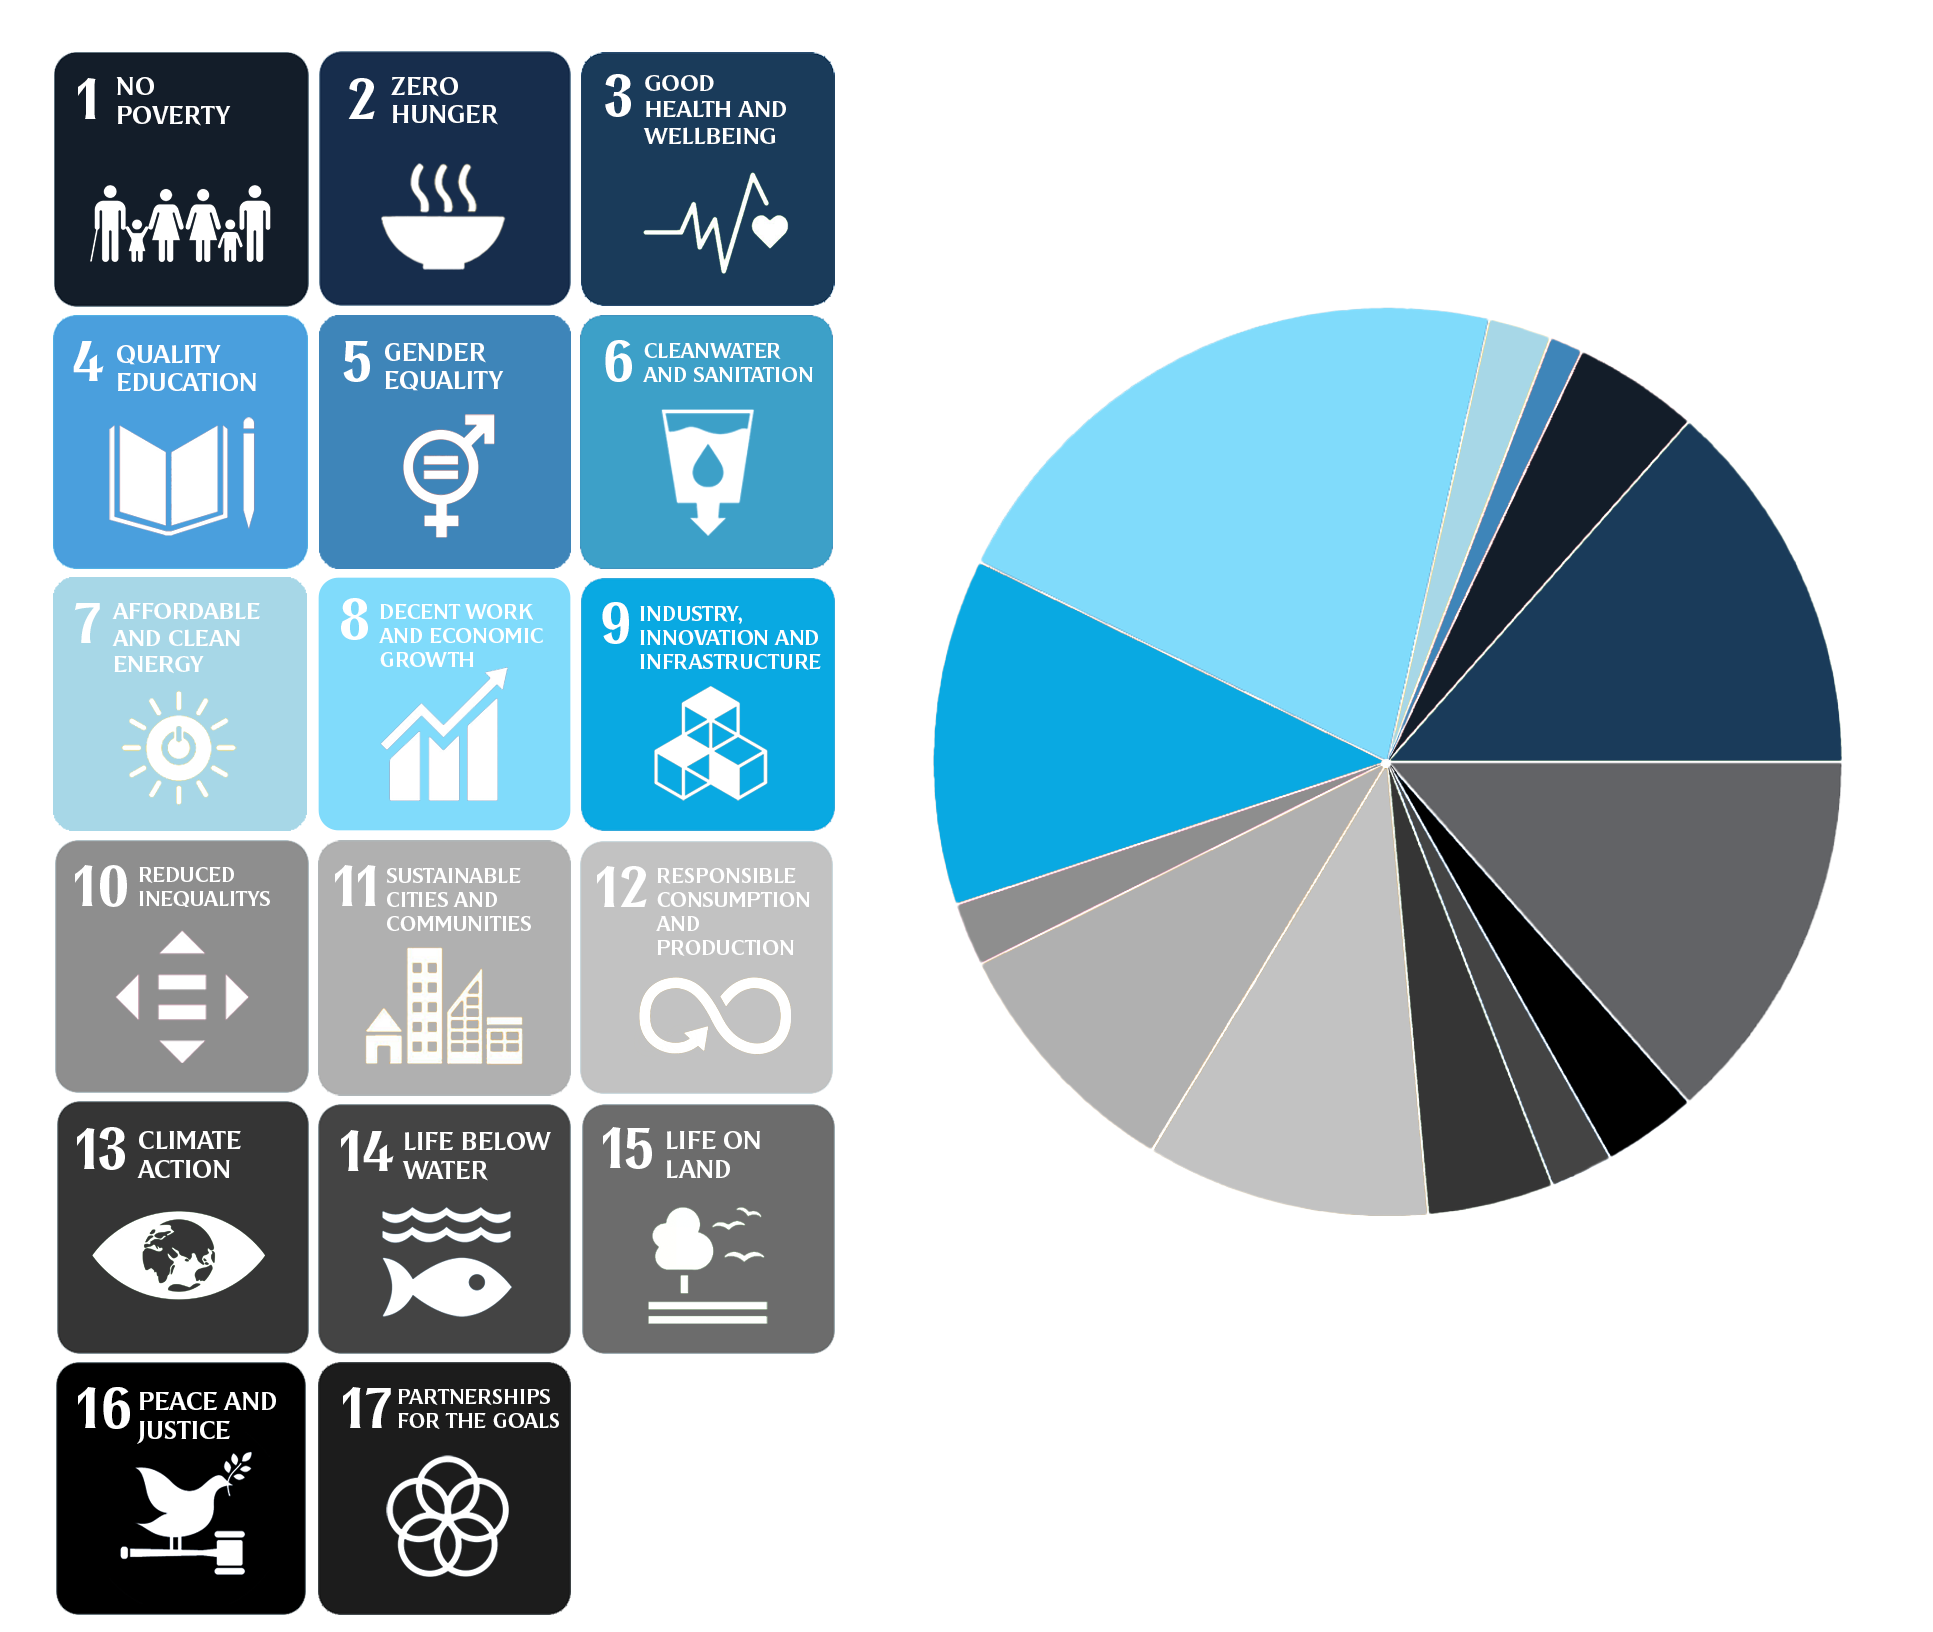
Based on our internal assessment of business models and missions, we estimate that around 80% of portfolio companies are meaningfully aligned with at least one SDG.
To test this assumption, we added a new question this year asking founders to self-identify as an “impact startup”. While around 45% said no, 35% answered yes and approximately 15% were unsure, highlighting that many founders may not see themselves as “impact” businesses – even when delivering clear positive outcomes.
A slightly smaller number of respondents also:
- Selected the SDGs their product or service contributes to
- Reported tracking impact-related KPIs
This suggests a gap: not just between ambition and labelling, but between intentionality and action. Many companies are creating value for people and the planet, even if they do not actively define or report it as such.
Our goal is to support founders building with purpose, translating intent into measurable progress, and, where possible, linking positive outcomes to stronger operational or financial performance.
SOCIAL PRACTICES & INCLUSION
Our data supports a familiar trend: social practices tend to increase as companies mature. Topics like wellbeing, DEI, and pay equity often gain traction after Series A, as teams grow and structures formalise. But maturity does not always mean follow-through.
Take gender pay gap tracking: 50% of seed-stage companies report doing it, rising to 57% at Series A – only to drop to 33% at Series B. This suggests that when these issues are not prioritised early, they risk falling through the cracks later on.
Still, we saw positive movement in outcomes:
The average unadjusted gender pay gap across the portfolio decreased for the second year in a row, from 17% in 2022 to 15% in 2023, and 12% in 2024. This downward trend is a sign of increasing pay equity across the companies we work with, even as overall diversity metrics dipped slightly this year.
That dip reflects broader dynamics:
- Portfolio growth and greater stage diversification
- An influx of early-stage, often male-dominated founding teams
- The ongoing representation gap across tech
Even so, engagement remains strong:
- 65% of companies promote DEI internally
- Wellbeing tracking continues to rise
- We continue to receive steady demand for inclusion-focused founder and team support
Our takeaway? The “S” is sticking—but it needs to be embedded, not performative.
RESPONSIBLE AI & DATA PRACTICES
AI is no longer an emerging theme – it’s here, and it’s reshaping how our companies operate, build, and compete. This year’s data confirms that shift: 82% of companies are now using AI in their product or operations, nearly double from last year.
Alongside adoption, governance practices are starting to take shape, but there is still ground to cover:
- Of those using AI, 45% report having implemented ethical safeguards
- Just 29% have a formal AI policy
- 39% of respondents self-classified under the EU AI Act, with a small (<5%) subset identifying as “high risk”. Typically those working in automation or other high-impact AI applications.
On the data side, 92% now have someone formally responsible for privacy and security – up 29 percentage points from last year, and 84(!) since 2022. This jump is especially visible at early stages, likely driven by a mix of AI expansion, regulatory pressure (including GDPR, DORA, and the AI Act), and customer expectations.
Overall, we see growing awareness that responsible data and AI practices are not optional. They are becoming core infrastructure. Our role is to help founders navigate this complexity through peer signals, expert input, and practical guidance that keeps pace with both regulation and innovation.
Looking Ahead
We hope this data helps founders benchmark, prioritise, and take action in ways that match their stage and structure – while raising the collective ambition for what responsible growth can look like.
We will continue updating this dashboard annually. Not just to track change, but to encourage it. Our aim is to surface timely insights, enable better conversations, and support companies in building long-term value through thoughtful, intentional practices.
As always, we are learning alongside our portfolio, and we welcome collaboration with others shaping the future of responsible growth.